SIMULATION
1. Simulation of a Single Rolled Sheet Structure
We used CanDo to simulate whether the single rolled sheet structure could actually be achieved. The simulation shows that the structure is as expected. (Fig.1,2)
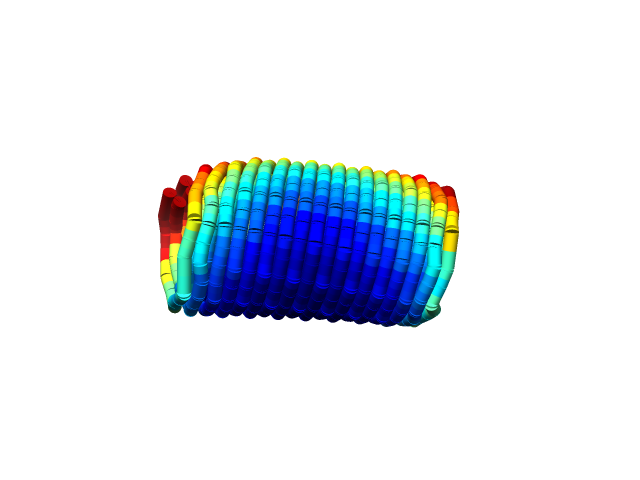
Fig.1 Simulation of the Structure
from the front in CanDo
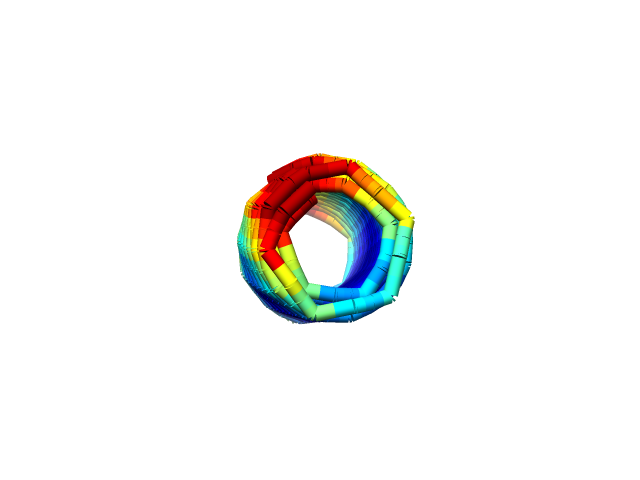
Fig.2 Simulation of the Structure
from the side in CanDo
2. Simulation of Back-to-back Construction of Double Sheets
We used oxDNA to simulate whether the back-to-back structure is actually achieved.
Two important parameters in the simulation to determine whether a back-to-back structure can be achieved are the number of pieces to be joined and the size of each adhesive area.
In the first model, the four corners of the sheet were tested with eight bases of adhesive ends. (Fig.3) In this model, the adhesive ends were quickly removed and a stable two-piece structure could not be obtained. (Mov.1)
Fig.3 Modeling in caDNAno
Mov.1 Simulation results for oxDNA
Next, the four corners of the sheet were tested with two staple strands at each of the eight nucleotide adhesive ends.(Fig.4) Similar to the previous model, no stable bipartite structure was observed in this model. (Mov.2)
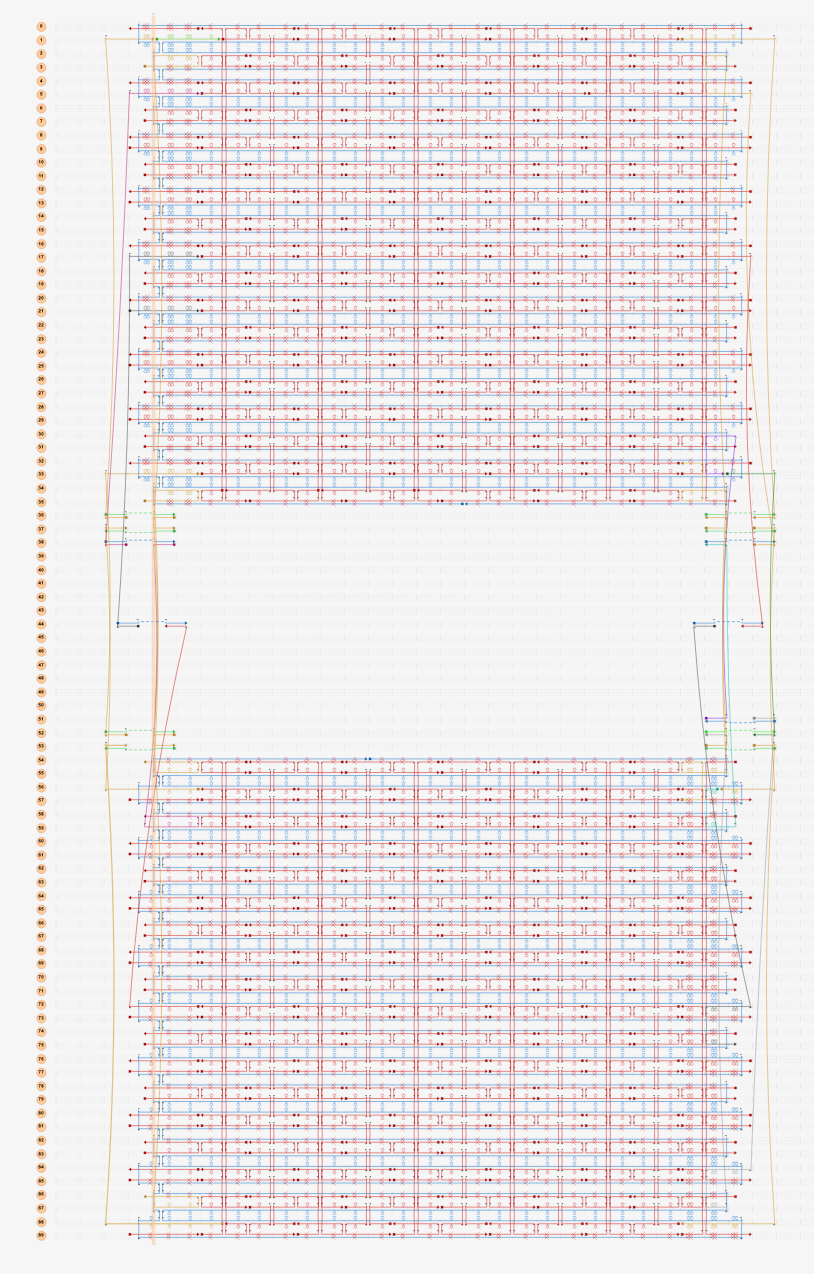
Fig.4 Modeling in caDNAno
Mov.2 Simulation results for oxDNA
In the next model, all staple ends of the sheet ends were used for adhesion.(Fig.5) In this model, the stable bipartite structure lasted longer than in the previous models, but eventually collapsed, which was not the result we were looking for.
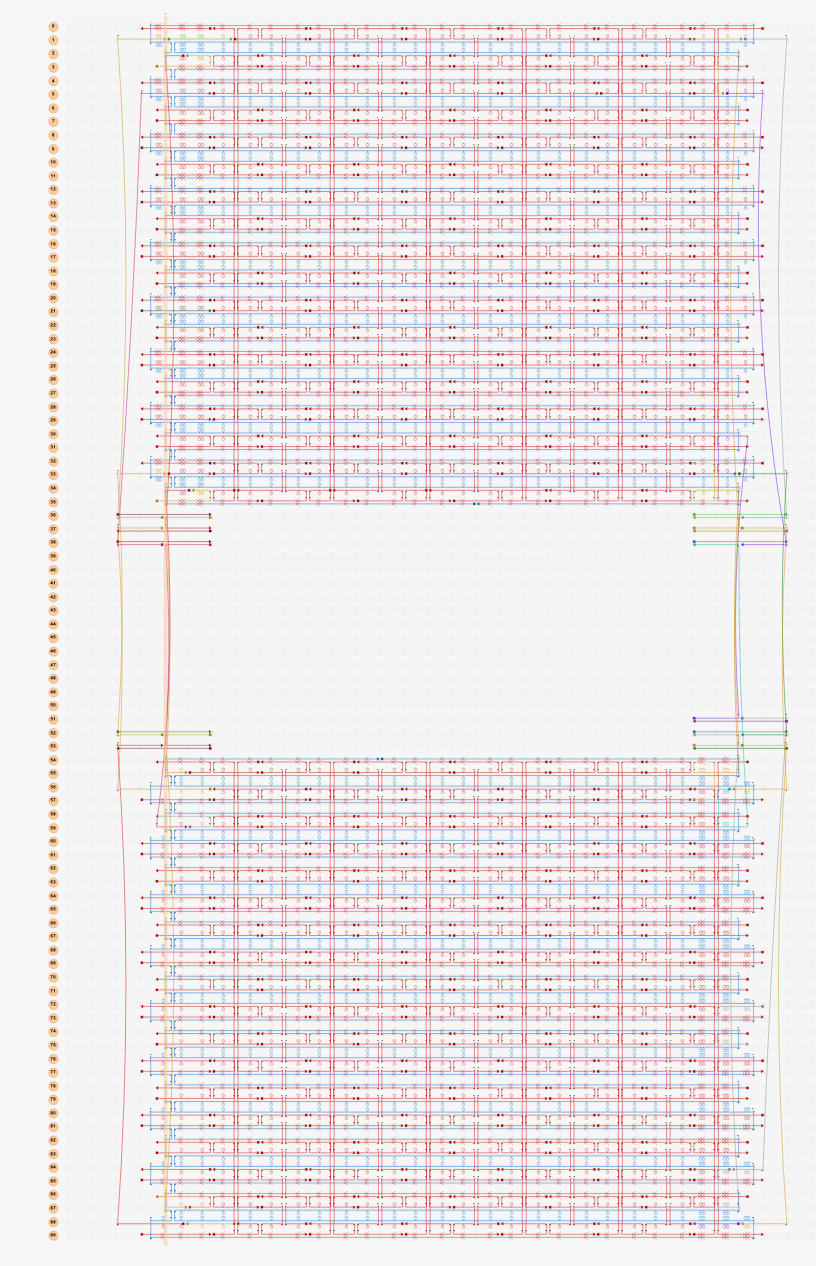
Fig.5 Modeling in caDNAno
Mov.3 Simulation results for oxDNA
In the last model, the adhesive region of the previous model was extended from 8 bases to 16 bases to enhance the adhesive strength.(Fig. 6) In this model, the staple, which was unable to withstand the stress and pulled out earlier, was able to maintain hybridization, and the bipartite structure was stabilized. (Mov.4)
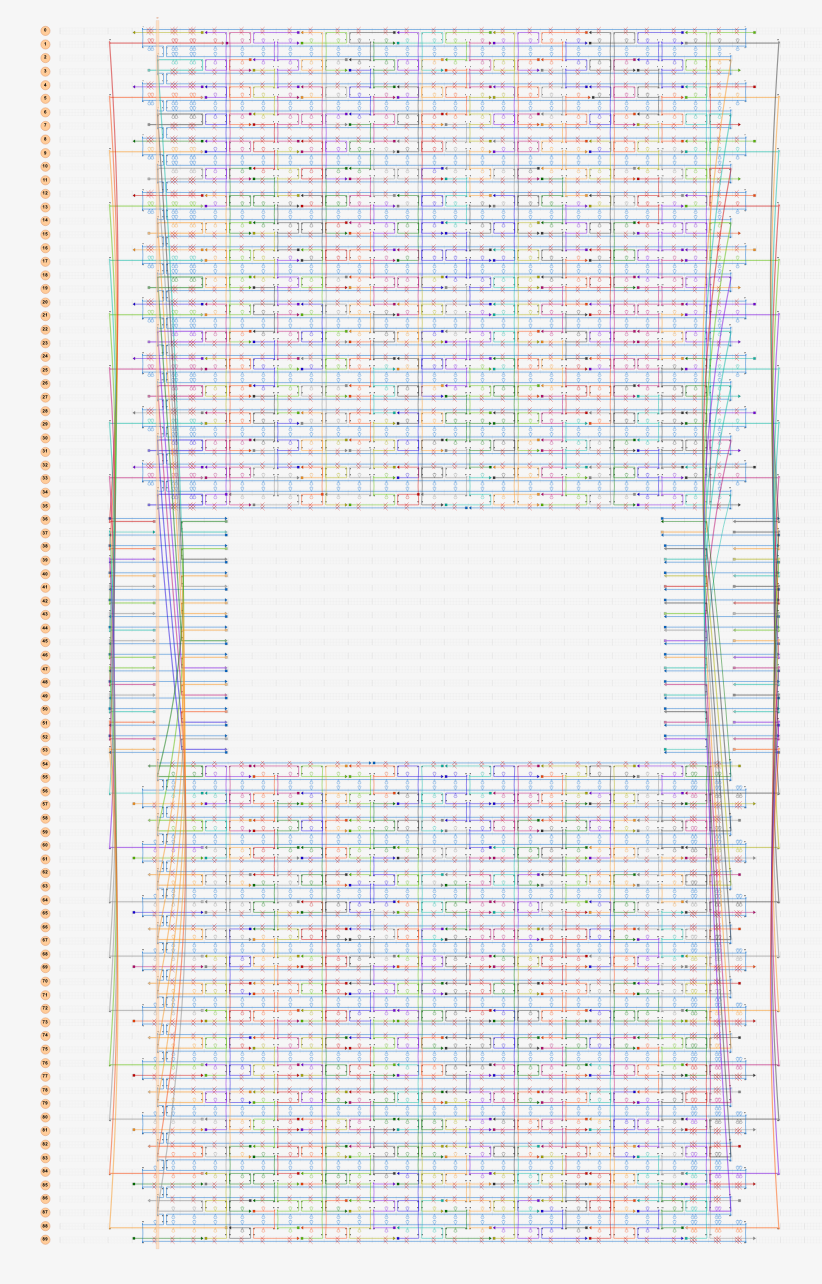
Fig.6 Modeling in caDNAno
Mov.4 Simulation results for oxDNA
3. Simulation of signal response mechanism using chain displacement reaction
Initially, when the target molecule is not present, the ends are held together by Smile. (Fig.7,8)
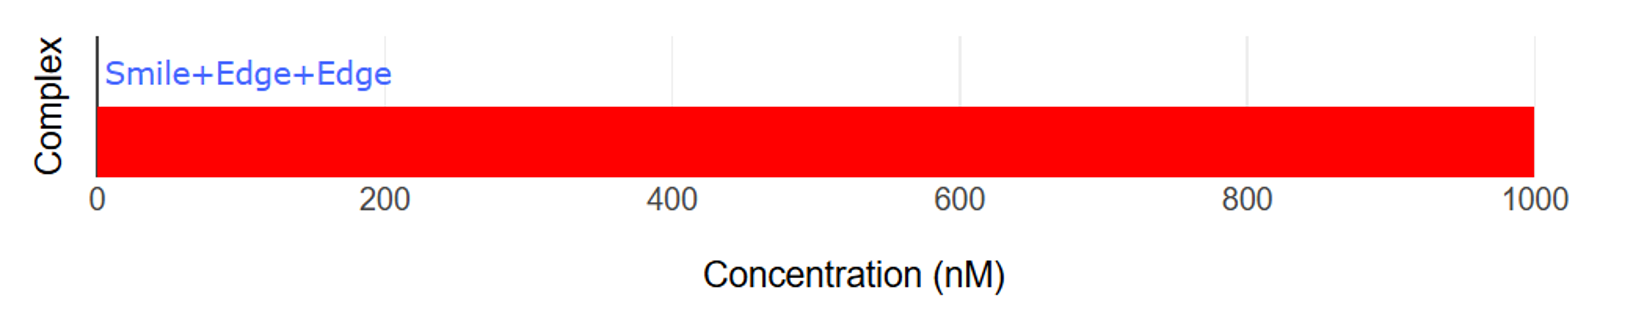
Fig.7 Graph of Smile and Edge bonding
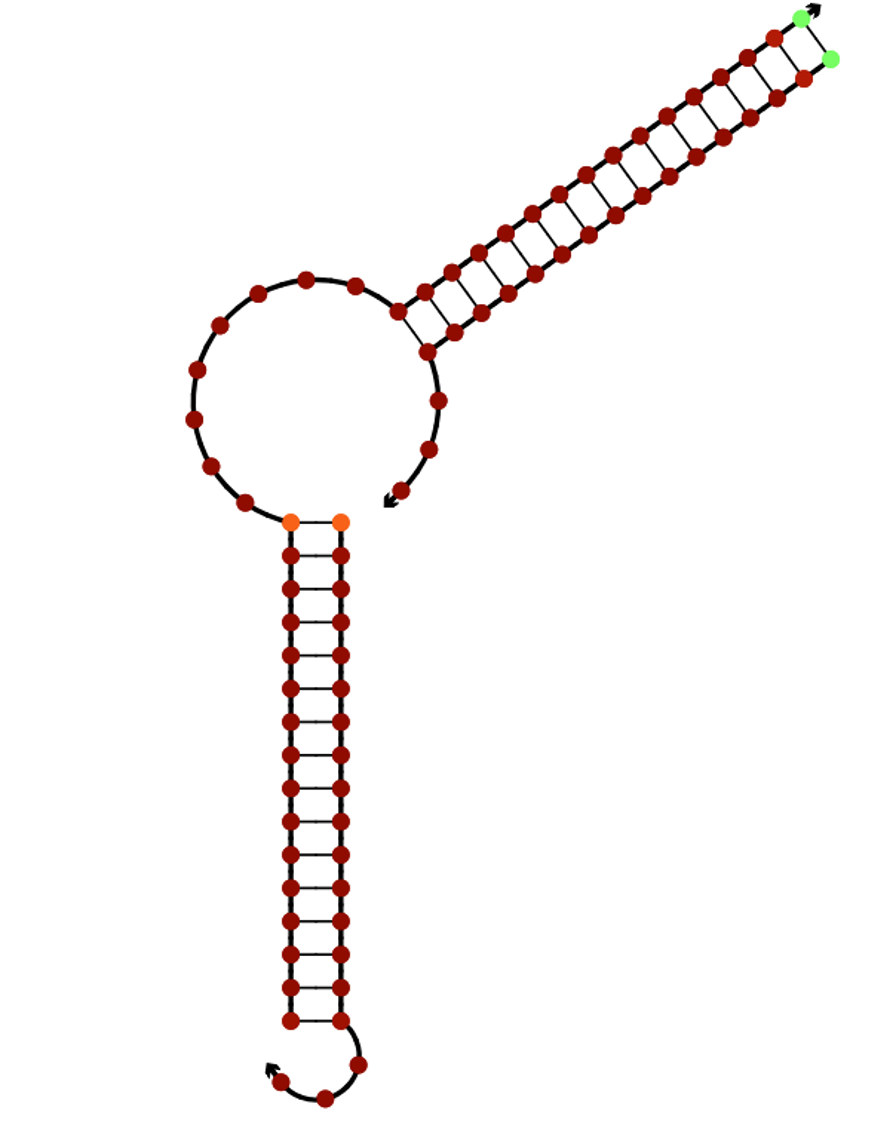
Fig.8 The binding of Smile and Edge
When a target molecule is present here, a chain displacement reaction occurs and the ends are separated from each other, thus supplementing the target molecule. (Fig.9,10)
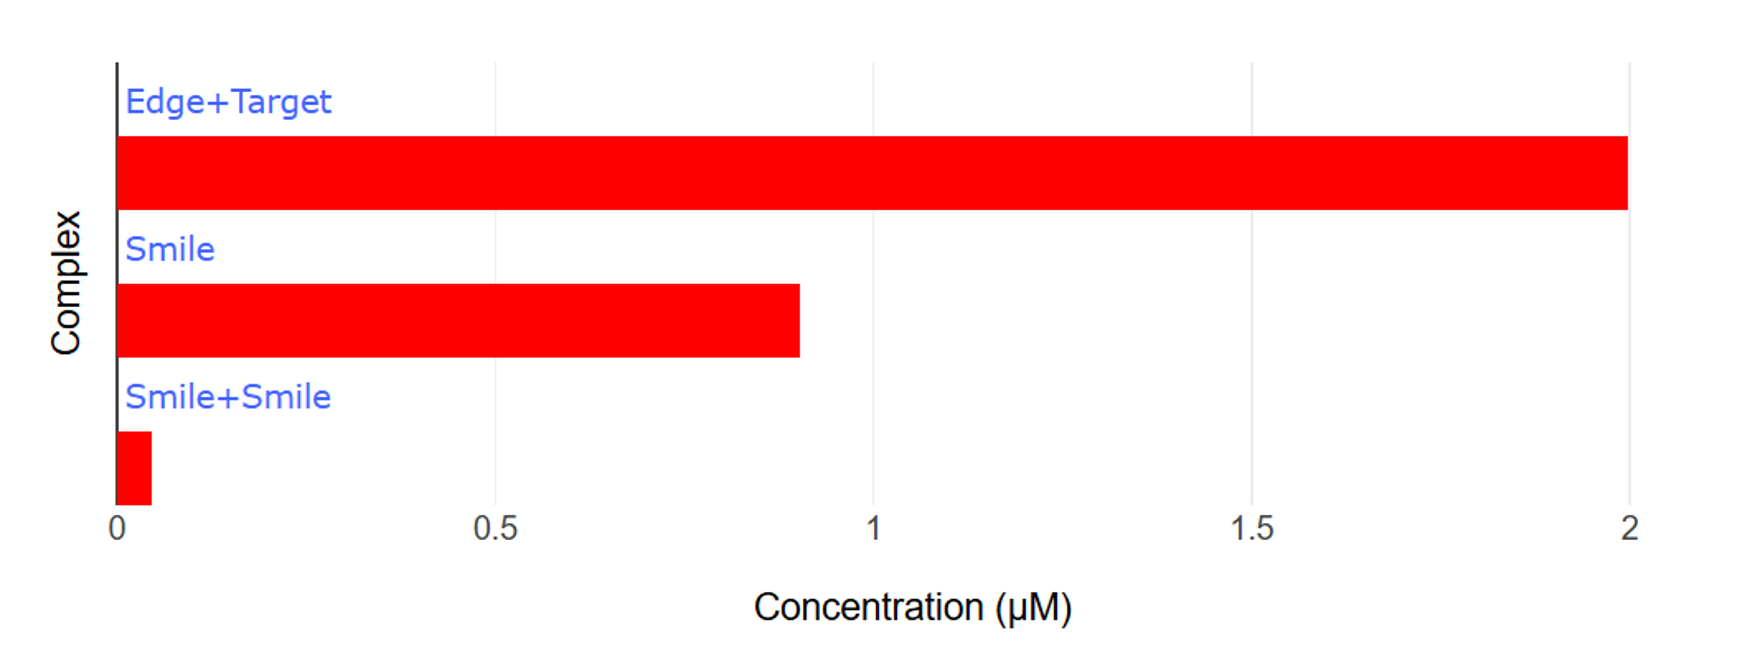
Fig.9 Graph of dissociation by Target
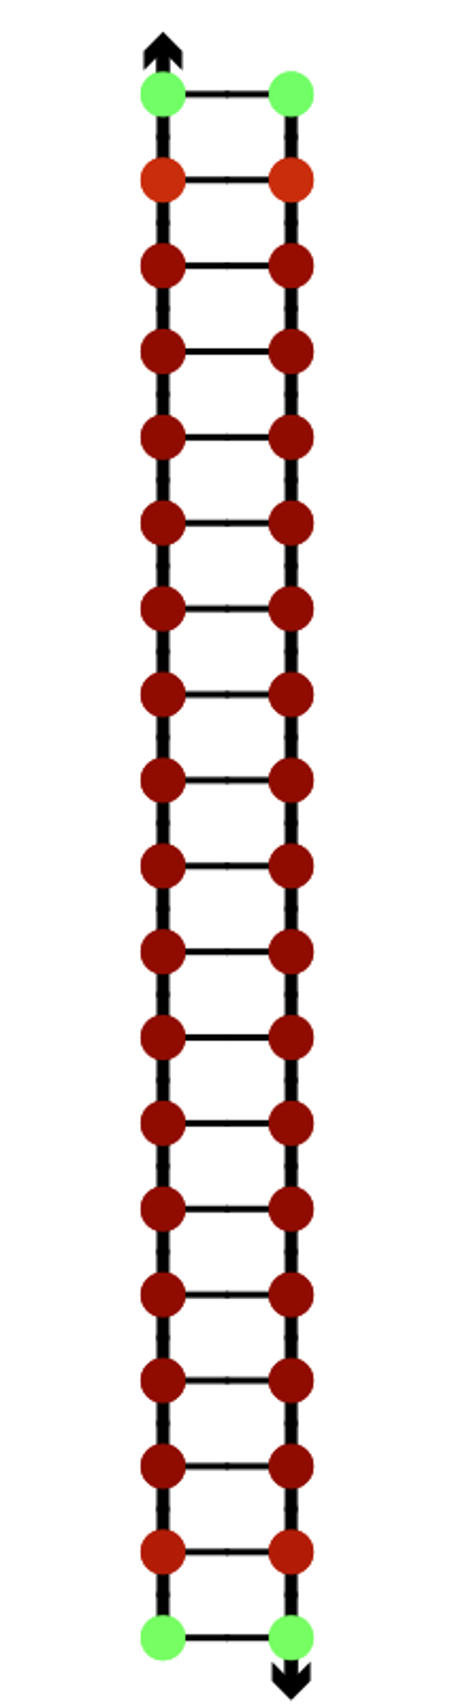
Fig.10 Dissociation by Target
4. Kinetic simulation of chain displacement reactions
We used Visual DSD to simulate the time scale over which the designed signal response mechanism proceeds. Visual DSD does not allow us to consider chain sequences, so we used sequence lengths created using NUPACK to perform the simulation.
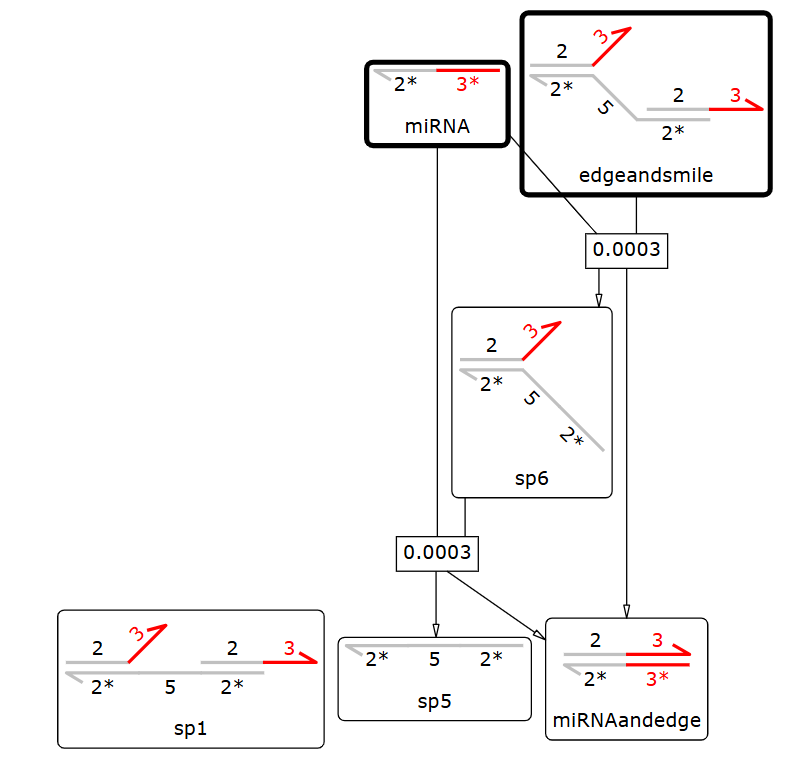
Fig.11 Reaction Pathway
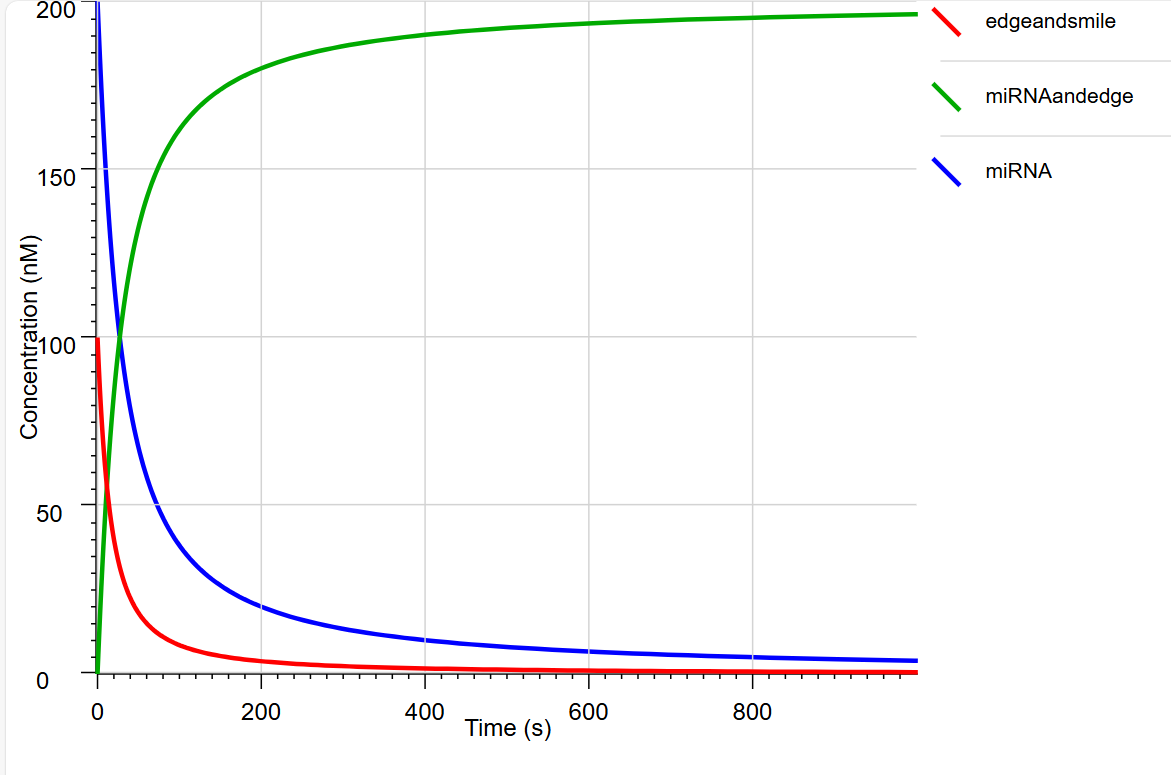
Fig.12 Graph of Visual DSD results
In the above graph, we can see that the concentration of edgeandsmile decreases due to the strand displacement reaction between miRNA and miRNA, while the concentration of miRNAand edge increases. This indicates that the strand displacement reactions in NUPACK, as designed by Wadatashi and his colleagues, are causing the release of the bipartite structure and the supplementation of miRNAs. We can also see that these reactions are completed in about 5 minutes. This indicates the possibility that some miRNAs are supplemented by the Nano Pill Bug before the miRNAs are completely degraded.
EXPERIMENT
Introduction
The focus of this project is the creation of a single rolled sheet structure. We experimentally demonstrate the feasibility of achieving a rolled sheet structure through the designed bending energy.
To prove that the sheet is indeed rolled, we created both an unfolded sheet structure, where the staple strands that form the central part of the sheet are removed, and a rolled sheet structure with all staple strands in place, then compared their sizes.
Annealing
The salt concentration and temperature conditions important for folding were determined based on the original paper [1] and empirical data. AFM was performed to observe the annealing results.
The annealing solutions and annealing times were adjusted according to the table below.
| Annealing Protocol |
|---|
| 85℃ for 3 min, from 65 ℃ to 45 ℃ at a rate of 1 ℃/min, from 45 ℃ to 25 ℃ at a rate of 0.5℃/min, 25℃ forever |
Tab.1
| First concentration | Amount | Final concentration |
|---|---|---|
| x50 TAE | 40 µL | x10 |
| 1M Mg2+ | 25 µL | 125 mM |
| MiliQ | 135 µL | |
| x10 Folding Buffeer | 200 µL |
Tab.2
| First concentration | Amount | Final concentration |
|---|---|---|
| Staple Mix(100 nM) | 99 µL | 99 nM |
| Scaff(990 nM) | 1 µL | 9.9 nM |
| Strand Mix(Sc : St = 1: 10) | 100 µL |
Tab.3
| Strand Mix(Sc : St = 1: 10) | 18 µL |
| x10 Folding Buffeer | 2 µL |
| Annealing Sample | 20 µL |
Tab.4
Agarose gel electrophoresis
Electrophoresis experiments using agarose gels were performed to confirm the annealing results. Annealing with different concentrations of magnesium ions (7.5-15.0 mM) showed bands that were considered to be good origami structures. However, at higher ion concentrations (17.5 mM and 20.0 mM), bands were observed at positions with larger molecular weights than the origami bands. This is thought to be due to the folding of the folded paper due to too high magnesium ion concentrations. In the two annealing runs with different strand concentrations, bands that could be origami were observed in both annealing runs. From these results, the solution composition during annealing was determined to be 12.5 mM magnesium ions, 10.0 nM scaffold strand, and 100 nM staple mix. However, no difference in band position could be identified between the open and closed structures. Therefore, the difference between these two structures was confirmed by AFM.
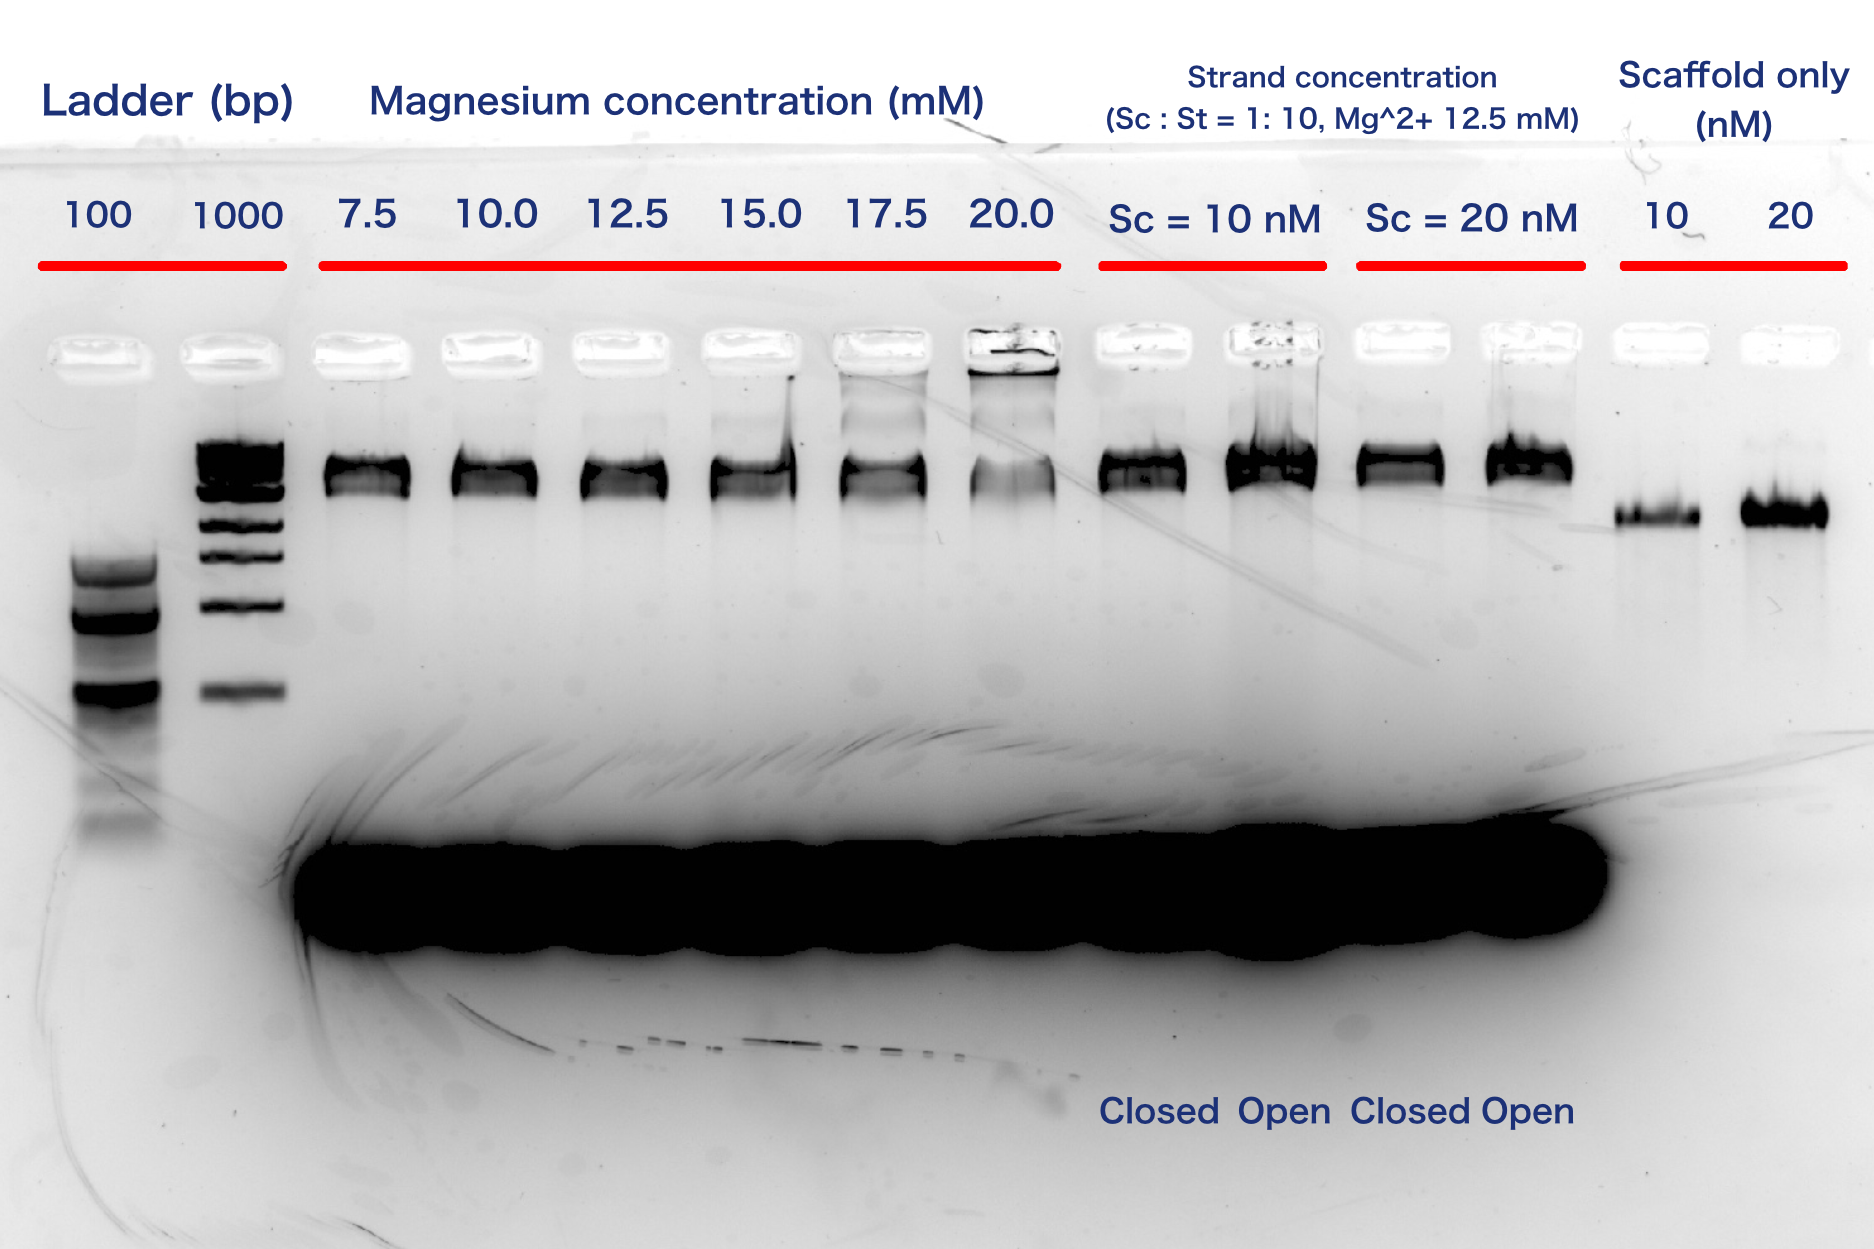
Fig.13 Agarose electrophoresis results
AFM
The AFM observation was performed by adding 20 µL of folding buffer (12.5 mM magnesium ions) to 10 µL of sample, incubating for 30 minutes, and adding 40 µL of folding buffer immediately before observation. A gourd-shaped structure was observed in the sample obtained by creating an open sheet structure, as shown in the figure. The closed sheet sample showed a spherical structure.
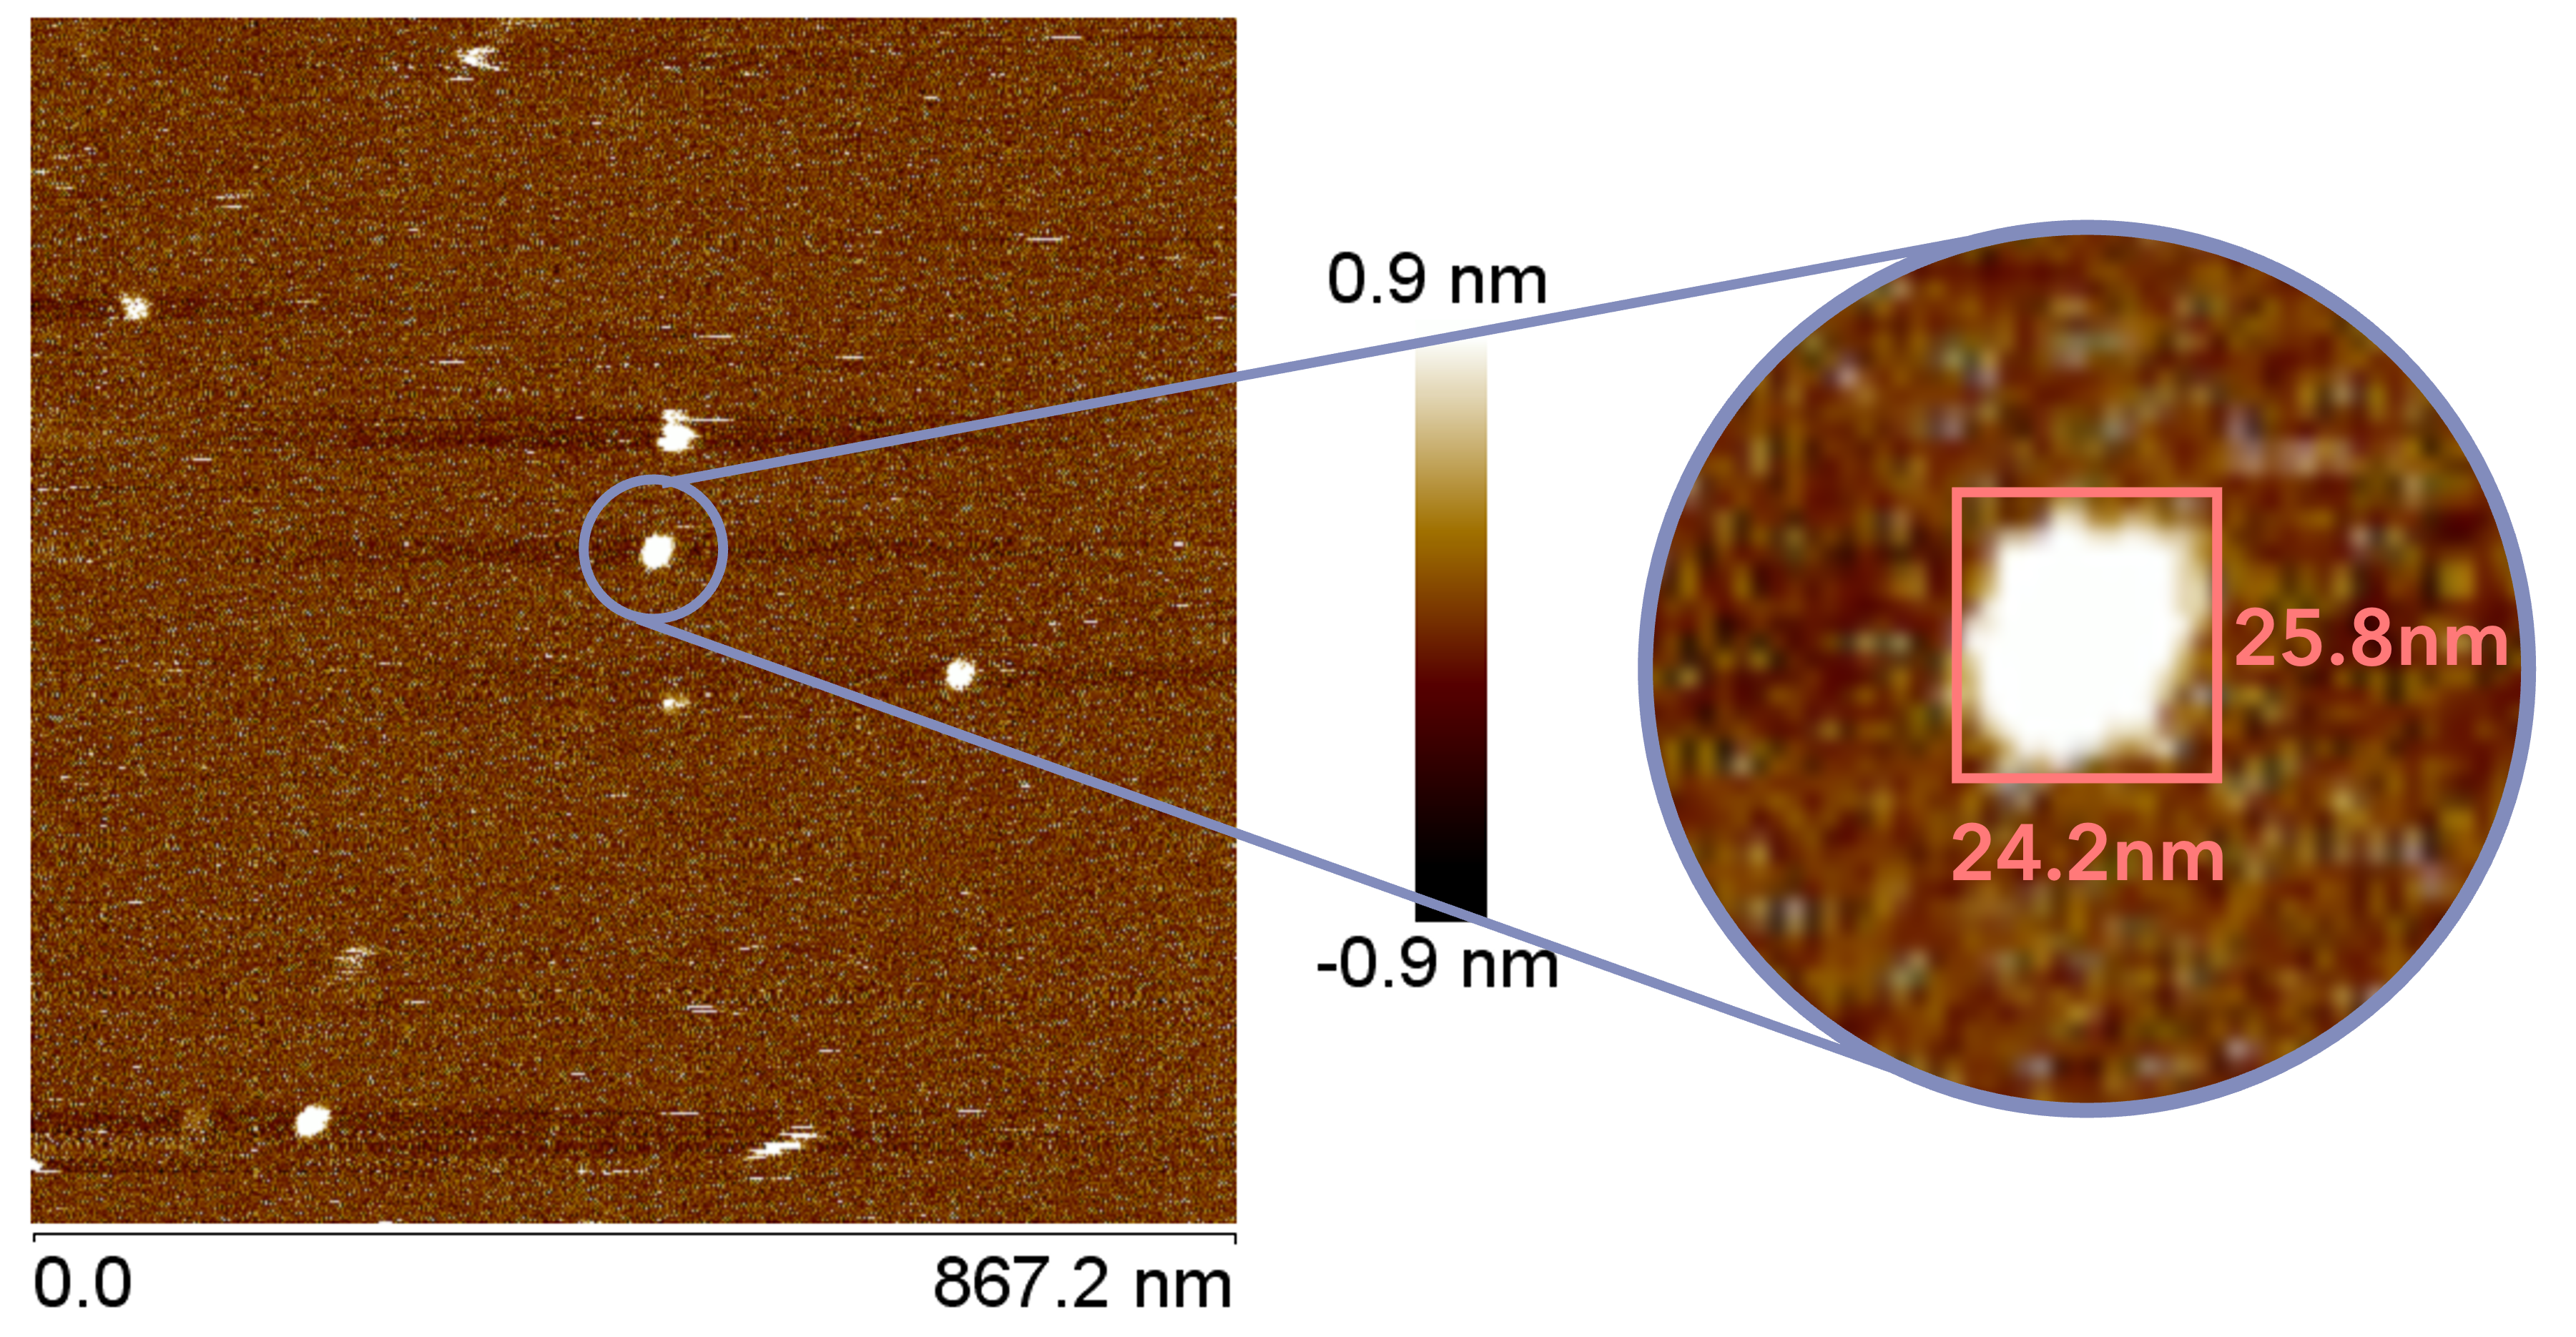
Fig.14 AFM Results
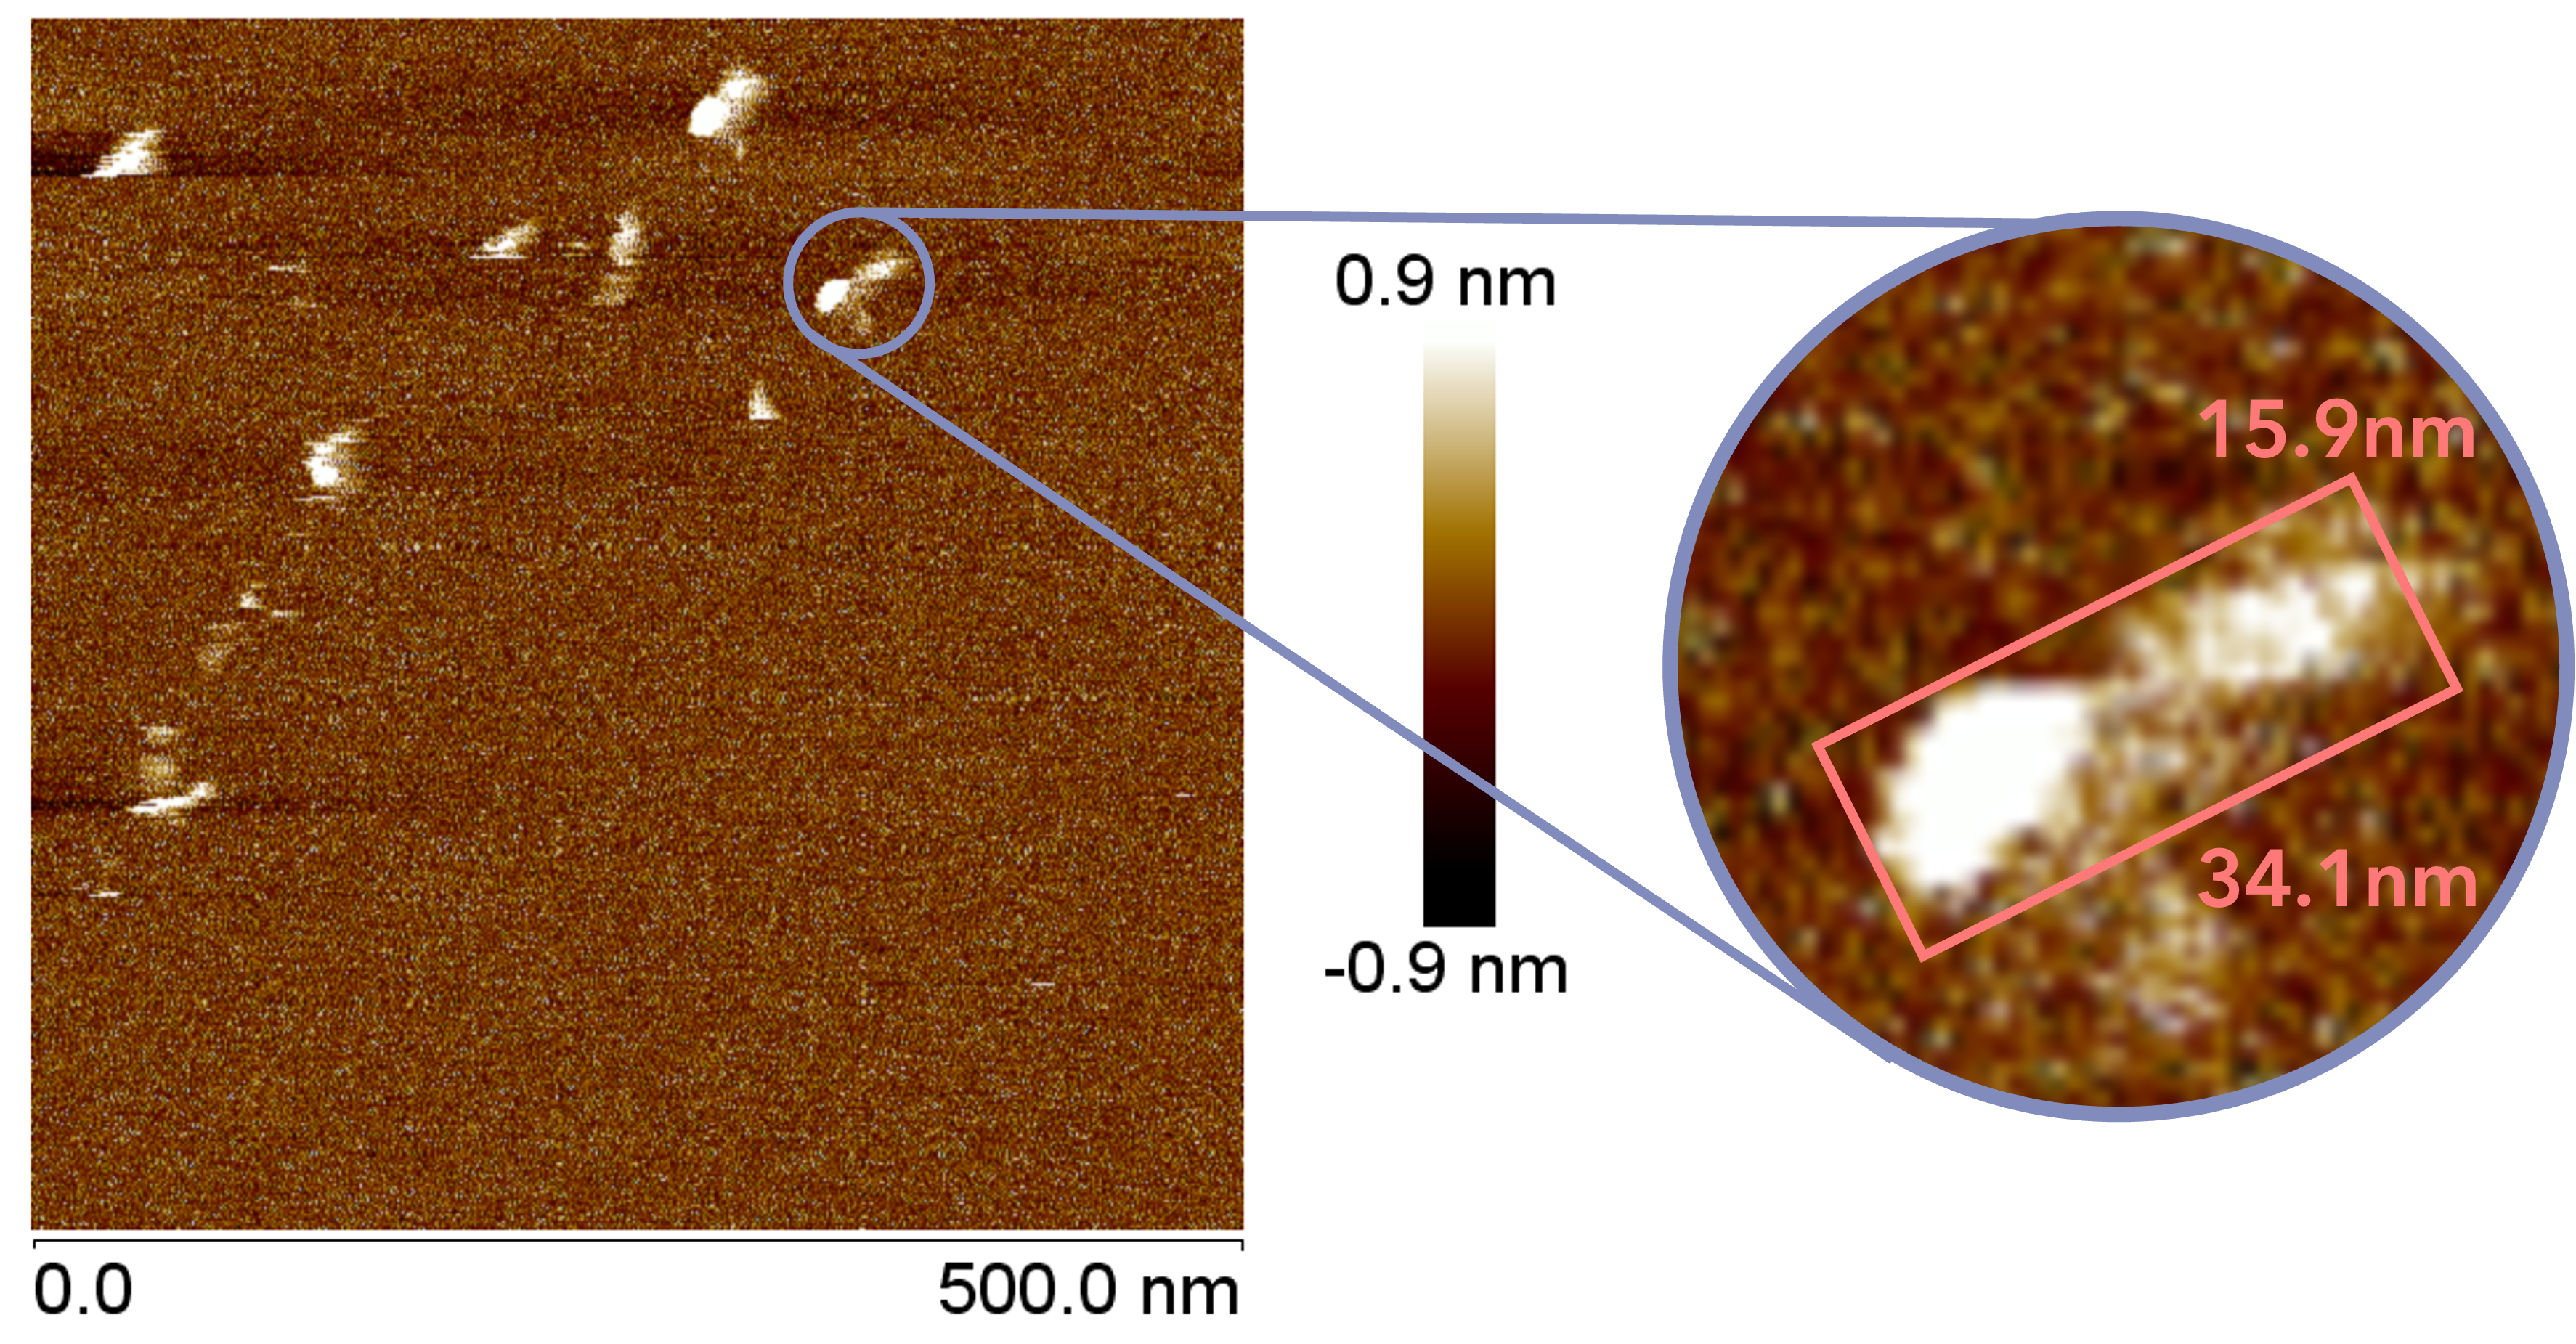
Fig.15 AFM Results
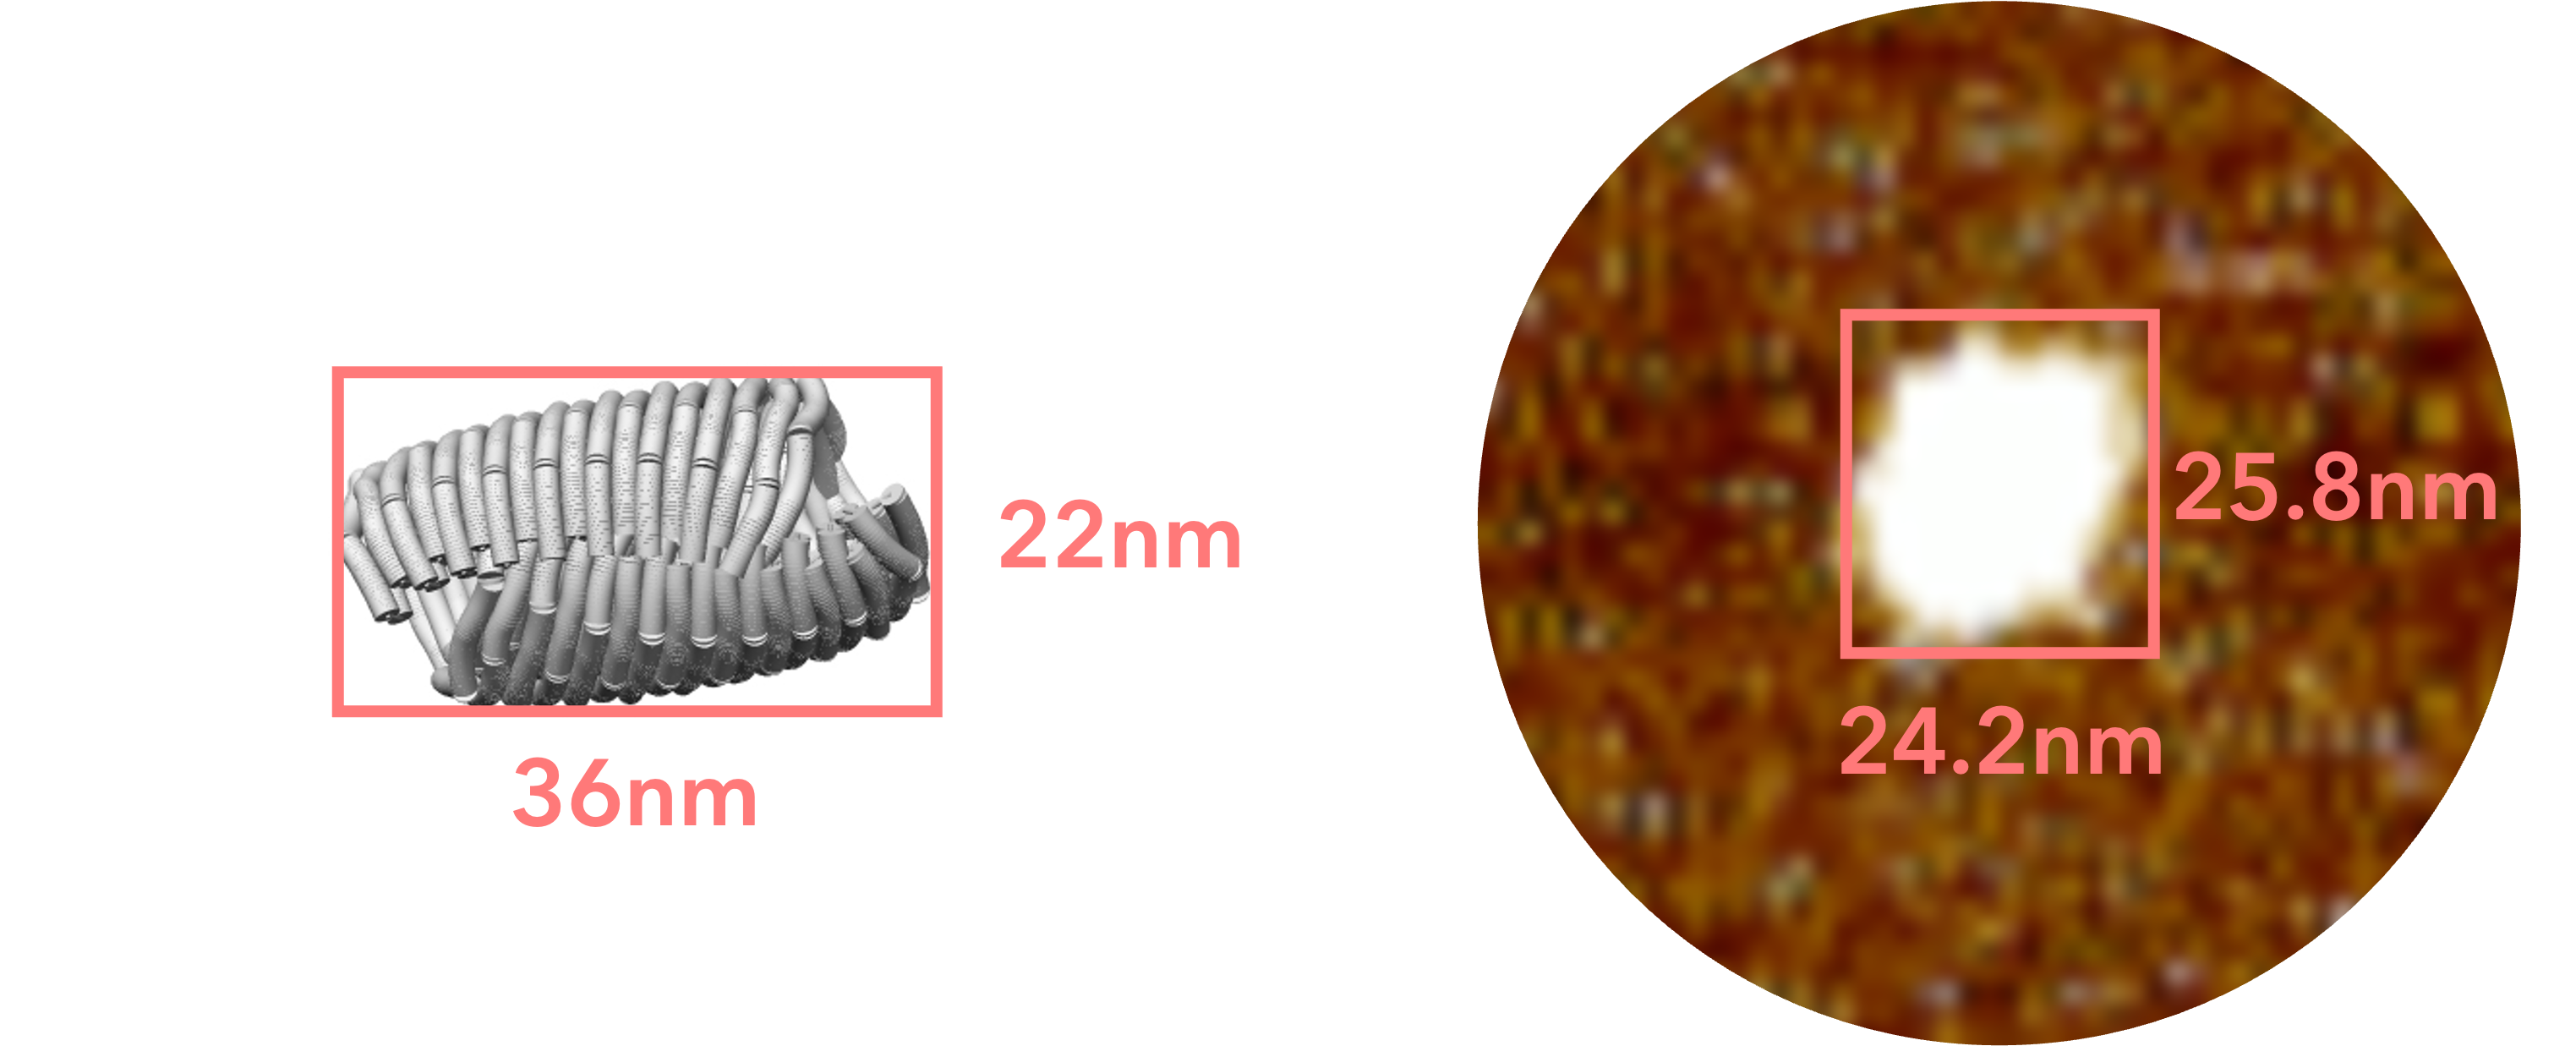
Fig.16 Comparison with simulation model
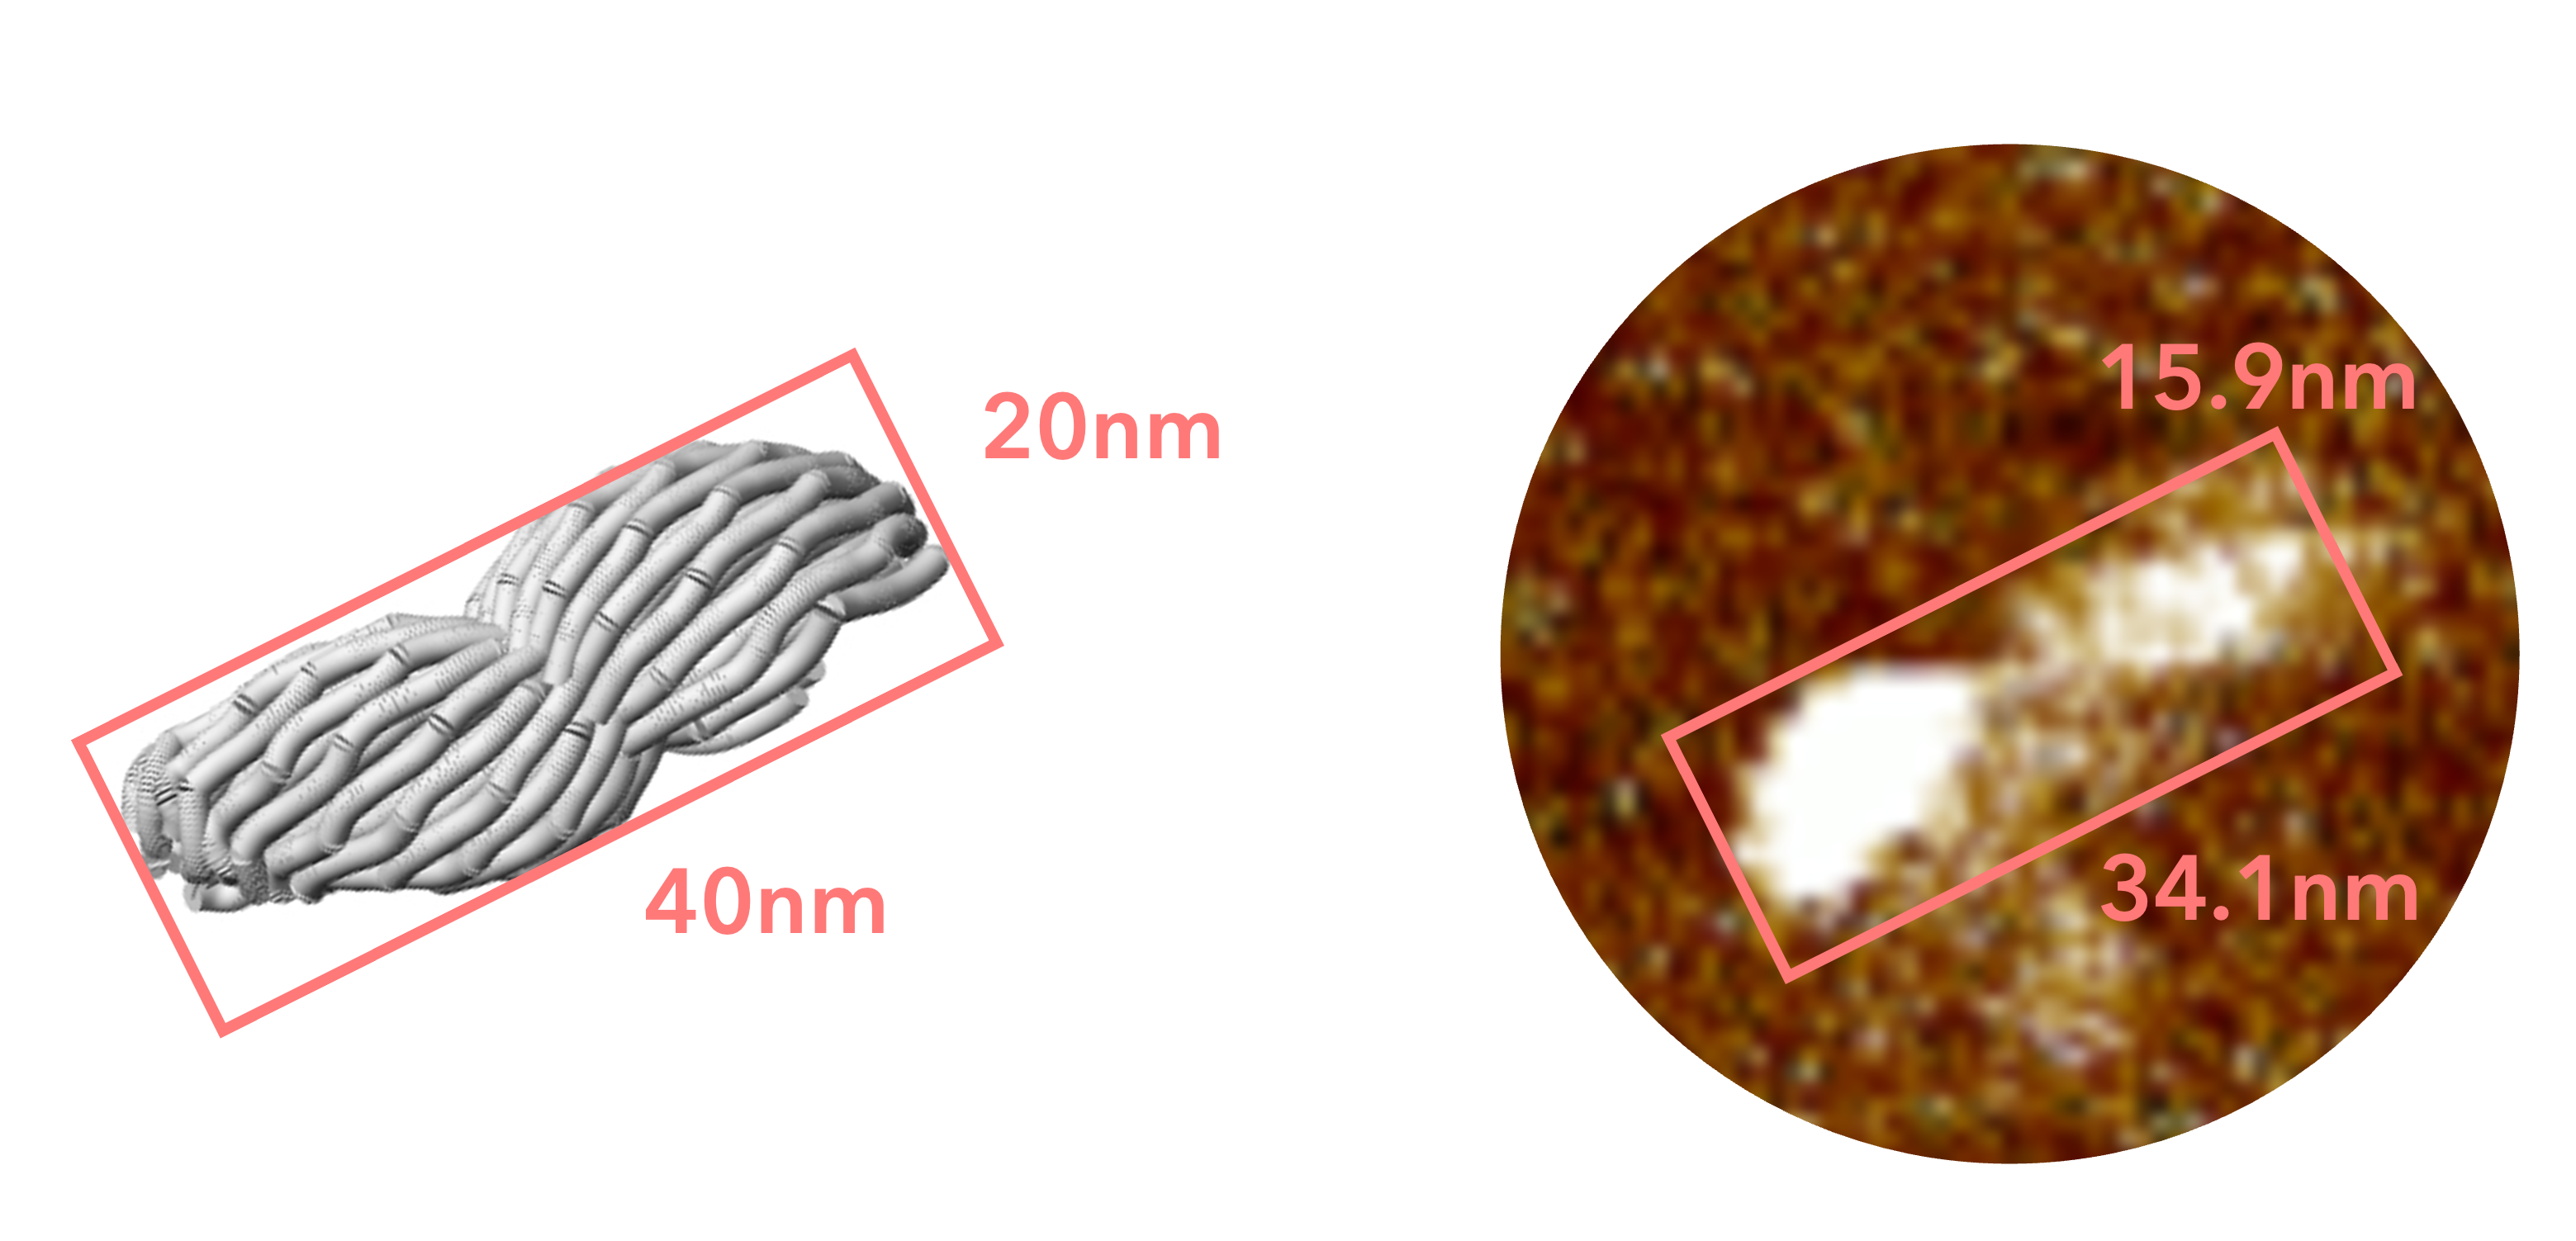
Fig.17 Comparison with simulatiopn model
This structure is lower in height than the closed sheet structure we designed, and is more spread out horizontally. As shown in the following figure, this is thought to be the result of the closed sheet structure collapsing due to the interaction between mica and origami, which caused it to stick to the mica perfectly.
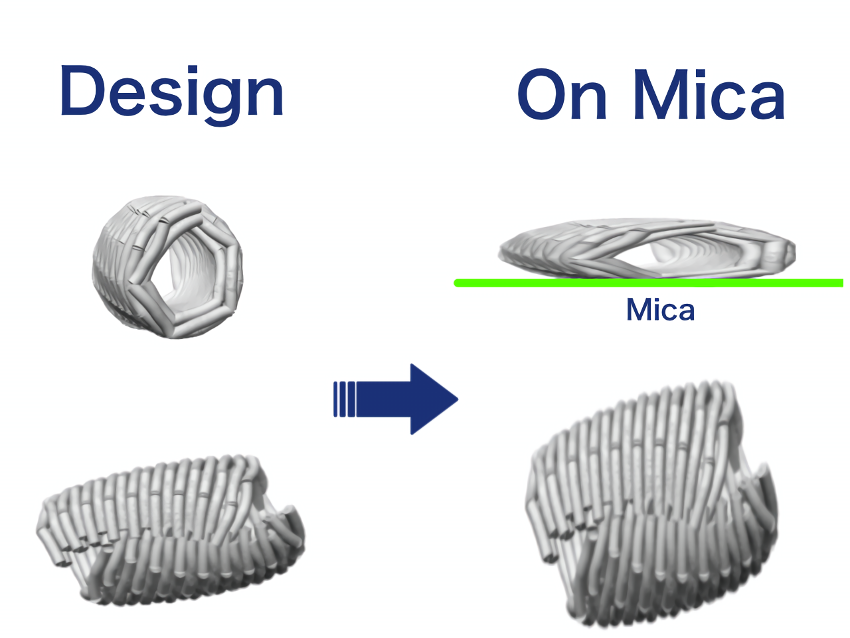
Fig.18 Our consideration
ACHIEVEMENT
We checked off the items for which the set goals were met. Of course, we also have to face the new problems that arise in the synthesis of the last two sheets.
- Design of "Nano Pill Bug", a single rounded sheet structure.
- Simulation of "Nano Pill Bug".
- Synthesis of "Nano Pill Bug".
- Design of a pair of "Nano Pill Bug", 2-sheet structure.
- Simulation of a pair of "Nano Pill Bug".
- Simulation of miRNA molecules responding to signals.
- Design of a pair of "Nano Pill Bug".
- Synthesis of a pair of "Nano Pill Bug".
- [1]Dietz H, Douglas SM, Shih WM. Folding DNA into twisted and curved nanoscale shapes. Science. 2009 Aug 7;325(5941):725-30. doi: 10.1126/science.1174251. PMID: 19661424; PMCID: PMC2737683.
- [2]oxDNAhttps://academic.oup.com/nar/article/48/12/e72/5843822
- [3]Bohlin, J., Matthies, M., Poppleton, E. et al. Design and simulation of DNA, RNA and hybrid protein-nucleic acid nanostructures with oxView. Nat Protoc 17, 1762-1788 (2022). https://doi.org/10.1038/s41596-022-00688-5
- [4]CanDohttps://cando-dna-origami.org/#:~:text=CanDo%20%E2%80%93%20Computer-aided%20engineering%20forhttps://cando-dna-origami.org/#:~:text=CanDo%20%E2%80%93%20Computer-aided%20engineering%20for